
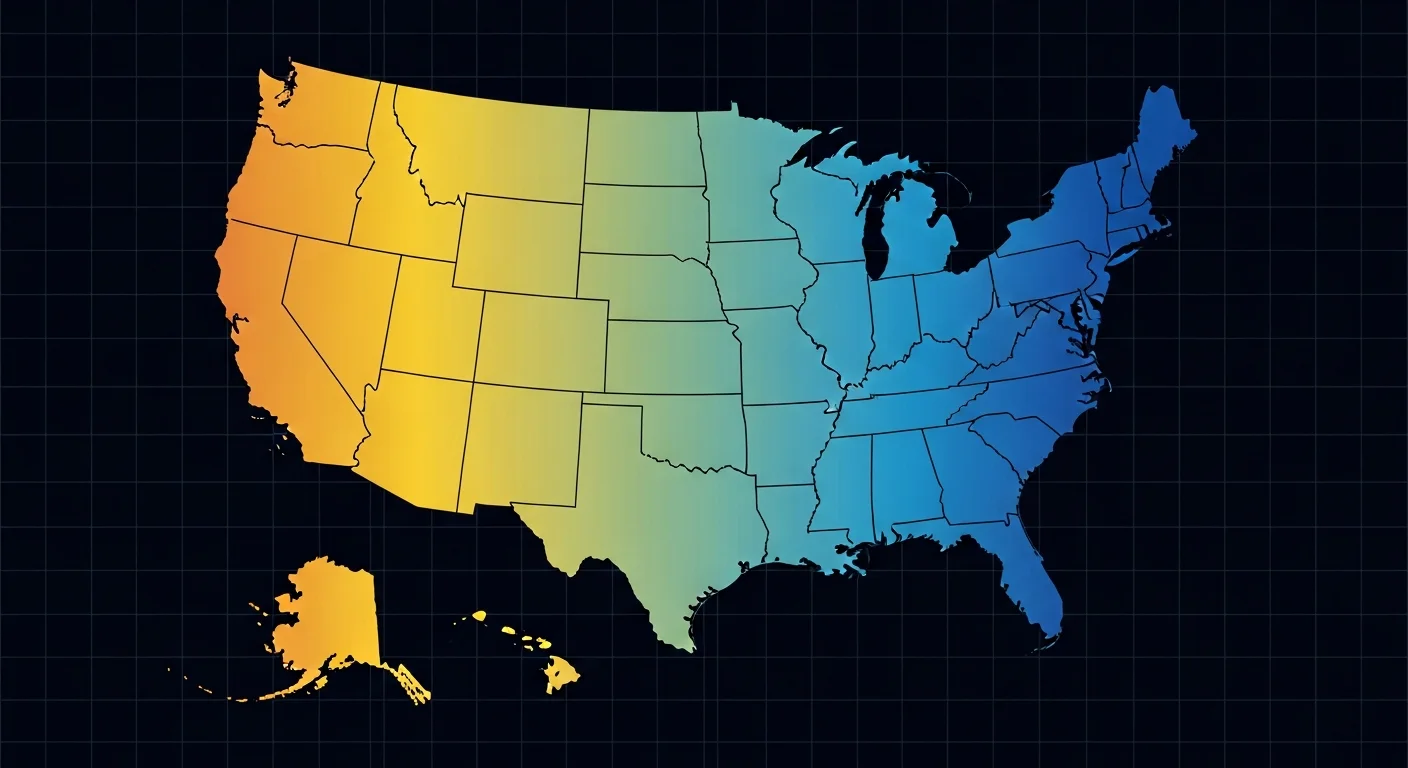
- 16 states were above the national all-items price level; 34 were at or below it.
- California had the highest housing-services RPP at 154.3.
- Calculated rent-burden shares ranged from 36.1% in North Dakota to 62.1% in Florida.
- Every row links to a detailed guide and the complete governed dataset is downloadable as CSV or JSON.
Cost of living in all 50 states
Regional price parities compare price levels across places within the same year, with the United States equal to 100. Values above 100 indicate an above-national price level for the index's consumption mix; values below 100 indicate a below-national level. The District of Columbia is shown but is not assigned a state rank.
California
Arkansas
of 50 states
computed ratios
Source: U.S. Bureau of Economic Analysis, SARPP, 2024. United States = 100. District of Columbia is excluded from state rankings.
| Rank | State | All-items RPP | Housing RPP | Median gross rent | Median housing costs | Median household income | Median owner value | Renter share | Rent burden 30%+ |
|---|---|---|---|---|---|---|---|---|---|
| 1 | California | 110.7 | 154.3 | $2,104 | $2,156 | $100,149 | $759,500 | 44.2% | 55.8% |
| 2 | Hawaii | 110.0 | 125.3 | $1,942 | $1,958 | $100,745 | $875,900 | 38.4% | 55.0% |
| DC | District of Columbia | 109.9 | 155.0 | $1,931 | $2,140 | $109,707 | $733,400 | 59.1% | 47.7% |
| 3 | New Jersey | 108.8 | 134.3 | $1,800 | $1,960 | $104,294 | $496,000 | 36.1% | 52.2% |
| 4 | New York | 107.9 | 122.2 | $1,634 | $1,661 | $85,820 | $449,800 | 45.7% | 51.5% |
| 5 | Washington | 107.0 | 126.0 | $1,824 | $1,841 | $99,389 | $602,200 | 37.1% | 50.7% |
| 6 | Massachusetts | 105.8 | 128.1 | $1,848 | $2,001 | $104,828 | $607,400 | 37.6% | 52.4% |
| 7 | Maryland | 105.0 | 121.1 | $1,721 | $1,807 | $102,905 | $436,300 | 32.2% | 51.5% |
| 8 | New Hampshire | 104.2 | 114.9 | $1,558 | $1,689 | $99,782 | $458,800 | 27.4% | 49.4% |
| 9 | Connecticut | 103.6 | 117.0 | $1,550 | $1,736 | $96,049 | $396,900 | 33.3% | 54.1% |
| 10 | Florida | 103.4 | 122.1 | $1,812 | $1,628 | $77,735 | $396,900 | 32.0% | 62.1% |
| 11 | Oregon | 103.4 | 108.6 | $1,597 | $1,596 | $85,220 | $497,500 | 36.9% | 52.3% |
| 12 | Colorado | 103.1 | 127.4 | $1,822 | $1,862 | $97,113 | $574,600 | 34.1% | 52.5% |
| 13 | Alaska | 102.4 | 93.8 | $1,444 | $1,507 | $95,665 | $376,500 | 33.5% | 41.5% |
| 14 | Rhode Island | 102.3 | 105.6 | $1,418 | $1,629 | $83,504 | $455,700 | 36.5% | 51.1% |
| 15 | Virginia | 101.1 | 106.8 | $1,646 | $1,594 | $92,090 | $403,500 | 32.9% | 49.3% |
| 16 | Arizona | 100.7 | 106.8 | $1,672 | $1,471 | $81,486 | $426,000 | 32.2% | 52.4% |
| 17 | Nevada | 100.0 | 114.1 | $1,709 | $1,625 | $81,134 | $455,500 | 39.9% | 57.6% |
| 18 | Illinois | 100.0 | 93.9 | $1,322 | $1,378 | $83,211 | $280,700 | 32.4% | 48.7% |
| 19 | Delaware | 99.8 | 102.0 | $1,530 | $1,431 | $87,534 | $371,600 | 26.2% | 50.3% |
| 20 | Utah | 98.9 | 107.8 | $1,593 | $1,626 | $96,658 | $545,200 | 30.4% | 48.2% |
| 21 | Minnesota | 98.6 | 91.3 | $1,291 | $1,392 | $87,117 | $344,600 | 28.4% | 47.7% |
| 22 | Vermont | 98.0 | 86.5 | $1,319 | $1,374 | $82,730 | $352,800 | 26.8% | 48.8% |
| 23 | Pennsylvania | 97.6 | 85.1 | $1,252 | $1,220 | $77,545 | $277,600 | 30.7% | 49.4% |
| 24 | Texas | 97.1 | 96.5 | $1,475 | $1,465 | $79,721 | $313,200 | 37.7% | 52.7% |
| 25 | Maine | 97.0 | 78.9 | $1,210 | $1,190 | $76,442 | $341,900 | 26.7% | 50.2% |
| 26 | Georgia | 96.3 | 88.7 | $1,506 | $1,417 | $79,991 | $343,300 | 33.7% | 53.1% |
| 27 | Michigan | 96.2 | 82.3 | $1,168 | $1,112 | $72,389 | $254,200 | 26.5% | 51.2% |
| 28 | Idaho | 95.5 | 90.0 | $1,384 | $1,249 | $81,166 | $446,400 | 28.3% | 48.4% |
| 29 | Montana | 94.6 | 84.6 | $1,177 | $1,176 | $75,340 | $425,400 | 31.4% | 42.7% |
| 30 | North Carolina | 94.3 | 81.4 | $1,338 | $1,250 | $73,958 | $333,000 | 33.2% | 51.5% |
| 31 | Wisconsin | 94.1 | 79.3 | $1,142 | $1,175 | $77,488 | $294,700 | 32.0% | 44.9% |
| 32 | South Carolina | 93.7 | 80.5 | $1,272 | $1,138 | $72,350 | $299,500 | 27.7% | 52.6% |
| 33 | Indiana | 93.3 | 73.9 | $1,104 | $1,082 | $71,959 | $243,500 | 29.3% | 48.5% |
| 34 | Ohio | 92.8 | 73.0 | $1,090 | $1,110 | $72,212 | $239,800 | 32.0% | 47.7% |
| 35 | Wyoming | 92.7 | 71.1 | $998 | $1,066 | $75,532 | $339,500 | 28.3% | 42.9% |
| 36 | New Mexico | 92.2 | 73.6 | $1,117 | $990 | $67,816 | $279,900 | 28.9% | 48.4% |
| 37 | Tennessee | 91.9 | 79.1 | $1,284 | $1,135 | $71,997 | $332,600 | 33.2% | 50.2% |
| 38 | Missouri | 90.8 | 69.9 | $1,067 | $1,089 | $71,589 | $254,400 | 31.4% | 45.2% |
| 39 | Kentucky | 90.2 | 64.3 | $998 | $960 | $64,526 | $226,000 | 31.9% | 45.2% |
| 40 | Nebraska | 90.1 | 75.2 | $1,102 | $1,183 | $76,376 | $263,100 | 33.3% | 46.5% |
| 41 | Kansas | 90.1 | 71.2 | $1,079 | $1,130 | $75,514 | $238,700 | 31.9% | 43.4% |
| 42 | West Virginia | 89.5 | 54.2 | $883 | $750 | $60,798 | $170,800 | 24.5% | 47.0% |
| 43 | North Dakota | 89.0 | 71.4 | $980 | $994 | $77,871 | $266,100 | 38.8% | 36.1% |
| 44 | Alabama | 88.8 | 61.8 | $1,077 | $988 | $66,659 | $233,300 | 29.0% | 48.2% |
| 45 | South Dakota | 88.6 | 67.6 | $999 | $1,073 | $76,881 | $289,600 | 31.7% | 41.9% |
| 46 | Louisiana | 88.2 | 63.1 | $1,064 | $1,013 | $60,986 | $223,200 | 31.9% | 54.1% |
| 47 | Oklahoma | 87.8 | 62.8 | $1,044 | $1,030 | $66,148 | $222,100 | 34.3% | 46.1% |
| 48 | Iowa | 87.8 | 65.3 | $981 | $1,039 | $75,501 | $227,300 | 28.7% | 43.2% |
| 49 | Mississippi | 87.0 | 56.5 | $990 | $893 | $59,127 | $186,500 | 29.5% | 50.3% |
| 50 | Arkansas | 86.9 | 58.2 | $982 | $912 | $62,106 | $215,600 | 32.9% | 45.5% |
The all-items and housing indexes answer different questions. A state can sit near the national overall price level while housing is substantially above or below it. The Census columns are separate medians, not components of the BEA index and not an affordability score.
Housing pressure is not the same as price level
The rent-burden column counts renter households spending at least 30% of household income on gross rent among households for which the ratio was computed. FinanceFirst derives the percentage from ACS table B25070 bands; the underlying table is for renter-occupied housing units. It should not be generalized to owners or used as a prediction for one household.
Source: U.S. Census Bureau, 2024 ACS 1-year table B25070. FinanceFirst calculation excludes renter households for which the ratio was not computed.
Florida has the highest calculated state share at 62.1%, while North Dakota has the lowest at 36.1%. That does not mean one is automatically “affordable” and the other is not. Incomes, housing stock, household composition and the distribution behind the medians differ.
How to use the comparison
- Use the all-items RPP for a first-pass comparison of broad state price levels.
- Check the housing RPP and real listings for the community where you would live.
- Rebuild after-tax income for the actual job and household.
- Add transportation, childcare, healthcare, debt, insurance and savings.
- Open the linked state guide for its complete component table and methodological limits.
How to read the numbers correctly
- RPP is a same-year price index: a value of 110 means the modeled broad price level is 10% above the U.S. level for that year. It is not a 10% inflation rate.
- Gross rent is not asking rent: ACS gross rent describes occupied renter units and includes contract rent plus certain tenant-paid utilities. It is not a feed of homes currently available.
- Monthly housing costs cover owners and renters: B25105 summarizes occupied units with monthly housing costs, so its universe differs from the renter-only gross-rent table.
- Income is descriptive: median household income is not a salary recommendation, qualification rule or after-tax amount.
- Survey estimates have uncertainty: detailed state pages show Census 90% margins of error for the principal estimates. Small apparent differences may not be meaningful.
Download and reuse the data
The CSV download provides one row per state, covered city and the United States. The JSON version adds source URLs, the calculation definition and preserved BEA and Census geography names. City rows deliberately keep a metro BEA geography beside a city Census geography so machines and researchers can see the boundary mismatch.
Methodology and sources
FinanceFirst sorted all 50 states by the unrounded 2024 all-items value in BEA table SARPP; the District of Columbia is disclosed separately. Housing uses SARPP line 3. Census values use the 2024 ACS one-year detailed tables B01003, B19013, B25003, B25064, B25070, B25077 and B25105. RPPs and derived percentages are rounded to one decimal for display. No commercial index, listing feed, forecast or universal budget is merged into the ranking.
The rent-burden numerator sums B25070 estimate categories 30.0–34.9%, 35.0–39.9%, 40.0–49.9%, and 50.0% or more. The denominator is the table total less “not computed.” The renter share divides B25003 renter-occupied units by total occupied housing units. These transformations are recorded in the public JSON.
- BEA table SARPP downloadable data
- BEA RPP methodology
- Census 2024 ACS summary-file documentation
- ACS B25003 housing-tenure table
- ACS B25070 rent-burden table
- ACS B25105 monthly-housing-cost table
Data period: 2024. Research date: August 22, 2026. Review after the next annual BEA or ACS release.
Frequently asked questions
Update log
August 22, 2026: Rebuilt the comparison from the complete official BEA and Census datasets, removed mixed commercial rankings and unsupported household-cost claims, and linked every state row to its detailed guide. The quality pass added housing costs, tenure and rent-burden values, two accessible charts, transparent derivations and downloadable CSV and JSON data.