Travel Chargebacks 2026: What Credit Card Disputes and Refund Complaints Reveal
Official card-dispute and air-travel refund data, current airline refund rules, a traveler evidence checklist and transparent limitations
Independent household-finance research
Follow the source, inspect the method, download the data, and understand where each finding stops. FinanceFirst turns public evidence into practical context without hiding the limitations.
Featured research

Official card-dispute and air-travel refund data, current airline refund rules, a traveler evidence checklist and transparent limitations
Research library
Search the complete library or narrow it by topic. Every report page keeps findings, methodology, citations and available downloads together.
Showing 11 reports
Source-linked · downloadable · independently published
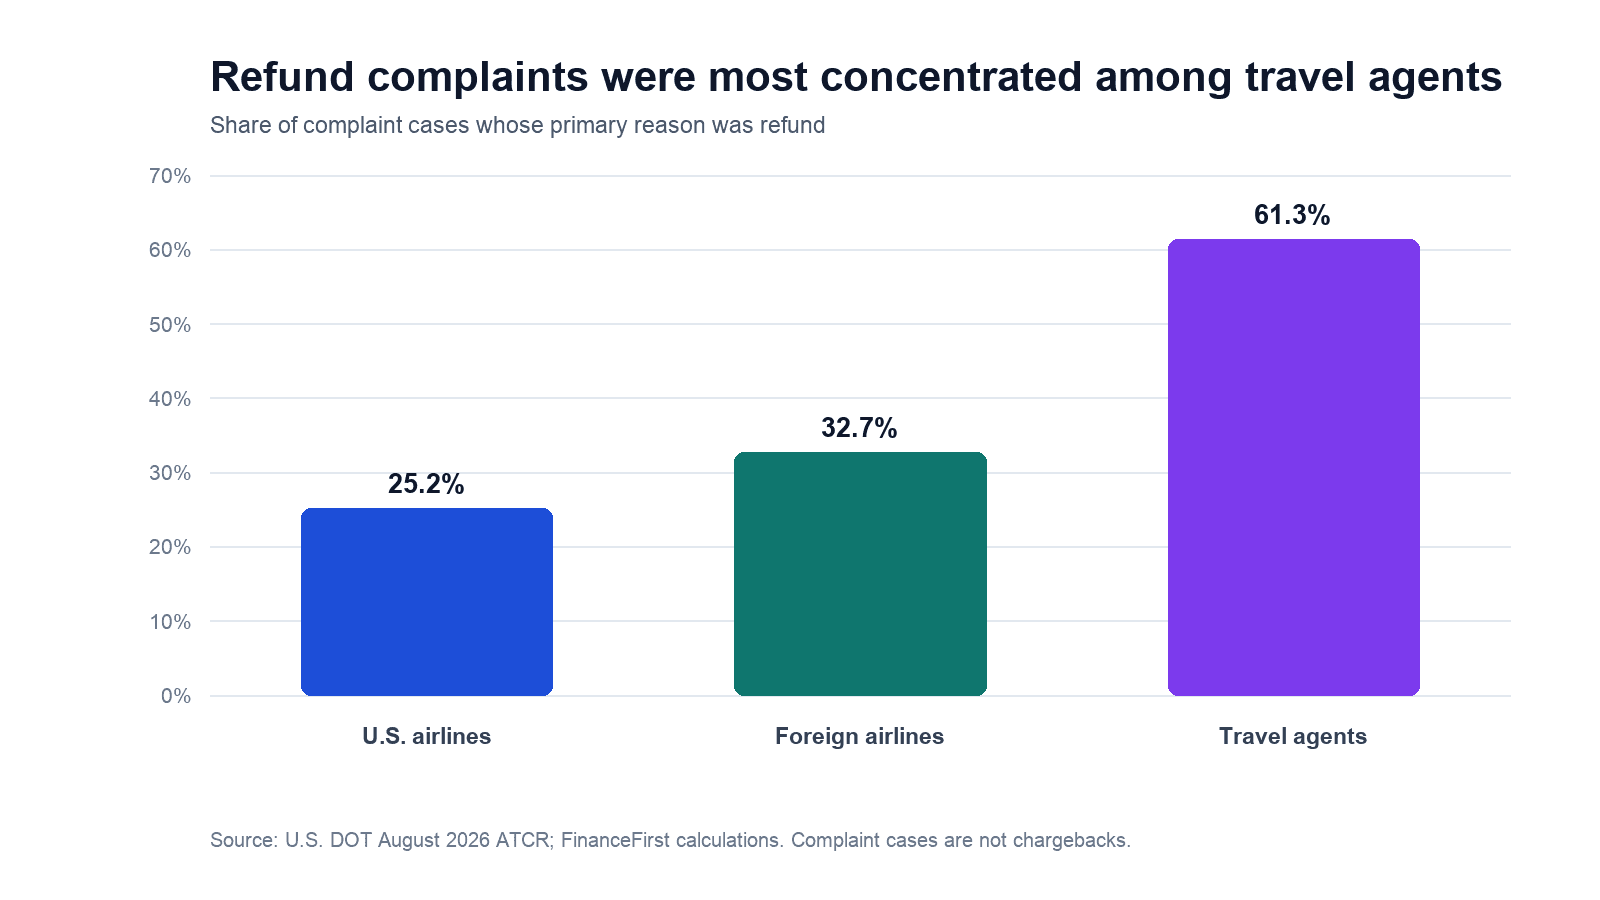
Consumer rights$9.8BPublic data show substantial card-dispute activity and travel refund friction, but not that chargebacks are becoming a first resort. This version adds current federal airline-refund rules, a source-reconciled comparison of refund complaint shares by organization type, and an evidence path that keeps merchant refunds, billing errors, unauthorized use and network disputes distinct.
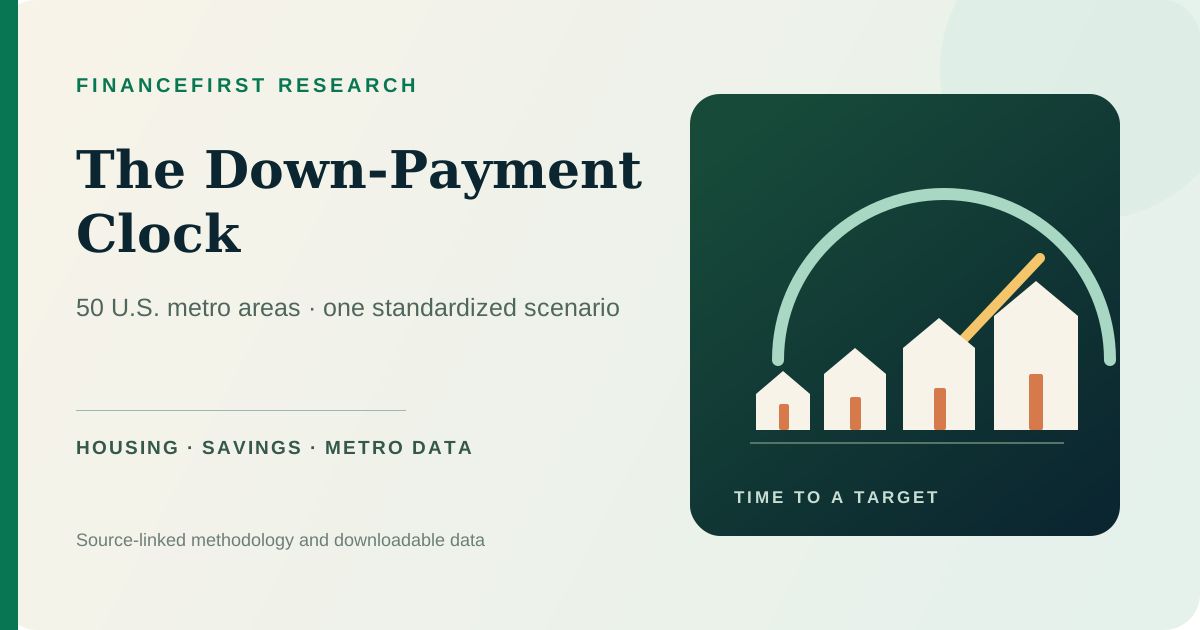
Under one standardized scenario, the estimated savings clock ranges from 3.5 years in Pittsburgh to 12.1 years in Los Angeles. These are comparisons built from published Zillow inputs, not forecasts or individualized home-buying timelines.
Banking & cash94%Banking access is widespread but not equal. In the Federal Reserve 2025 survey, 94% of adults had a bank account, yet 12% of banked adults reported paying an overdraft fee. The reported share was 25% among Black banked adults and 8% among White banked adults. Separately, the FDIC estimated that 4.2% of U.S. households were unbanked and 14.2% were underbanked in 2023. This report keeps those populations separate, adds current evidence on financial resilience and digital access, and turns the findings into a seven-setting account-control audit.
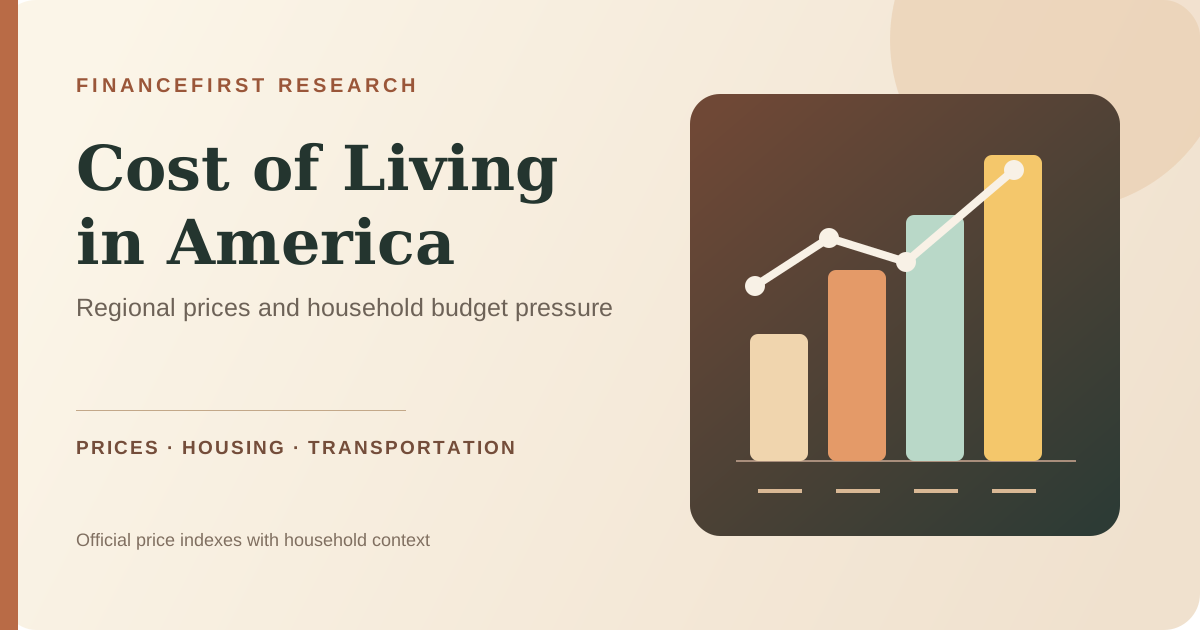
BEA data show 2024 state price levels ranging from 86.9 in Arkansas to 110.7 in California. BLS found housing and transportation absorbed 50.4% of average 2024 spending, while 58% of adults told the Federal Reserve that price changes worsened their finances in 2025.
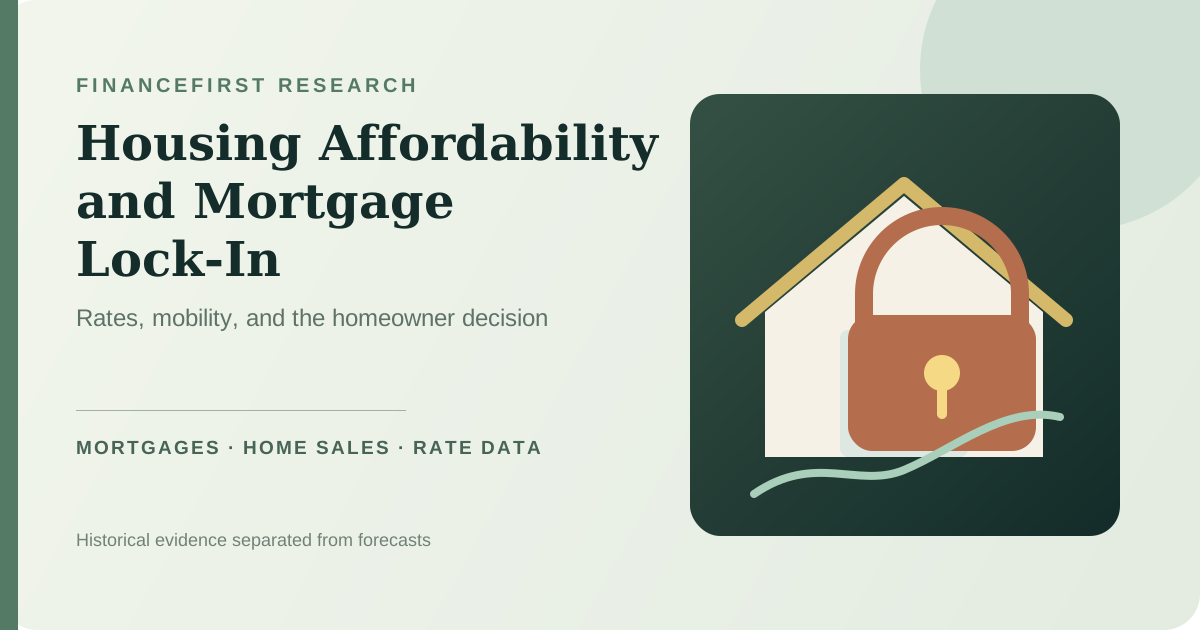
The average 30-year mortgage rate was 6.55% on July 16, 2026. FHFA research found that rate lock-in materially reduced fixed-rate home sales in 2022–2023, but its estimates are historical—not forecasts for today or an individual homeowner.
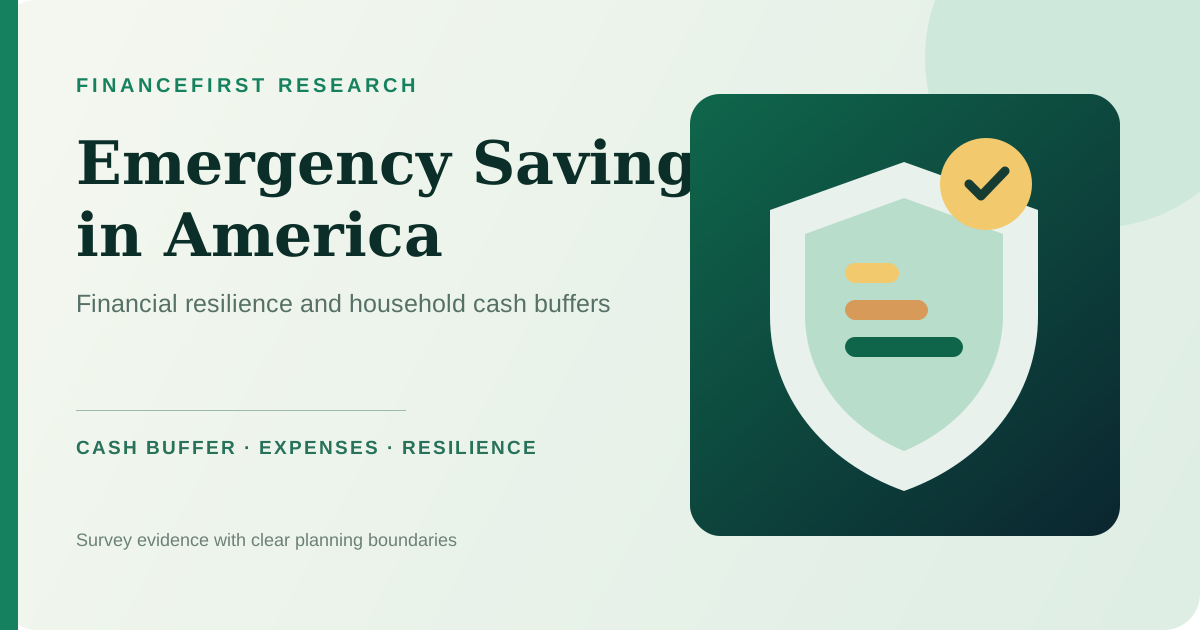
In 2025, 63% of U.S. adults said they could cover a $400 emergency with cash or its equivalent, while 55% had three months of expenses set aside and 30% could not cover three months by any means.
Home values surged more than 47% nationally since 2020 according to FHFA data, pushing millions of long-term homeowners closer to exceeding the $250,000 capital gains exclusion. This report analyzes who is most at risk, how the exclusion works, and what the real tax implications look like when you sell.
Retirement35%Only 35% of non-retirees said their retirement plan was on track in the Federal Reserve 2025 survey. BLS found 72% of private-industry workers had access to retirement benefits in March 2025, while 53% participated.
Taxes & debt$18.794TU.S. household debt totaled $18.794 trillion in Q1 2026, up $18 billion from the previous quarter and $591 billion from a year earlier. Credit-card balances declined seasonally to $1.252 trillion but remained $70 billion higher year over year, while 4.8% of total debt was in some stage of delinquency and the share of student-loan balances 90 or more days past due rose to 10.3%.
Taxes & debt$4.9TThe 2026 tax filing season is underway, with more than 150 million individual returns expected. This report examines who actually pays federal income taxes, how effective rates differ from marginal rates, which deductions and credits matter most, how state taxes create winners and losers, and why the IRS estimates $688 billion in taxes go uncollected each year. Data from the IRS, Tax Foundation, CBO, and Joint Committee on Taxation.
Household costs$331,000+The USDA stopped publishing its landmark 'Cost of Raising a Child' report in 2017. Since then, parents have been left piecing together data from dozens of fragmented sources. This report consolidates the latest figures from the USDA baseline, Brookings Institution updates, BLS Consumer Expenditure Survey, Care.com, Child Care Aware of America, and the College Board to deliver the most complete picture of what it actually costs to raise a child in America today.
Built for verification
A polished chart is not evidence by itself. FinanceFirst reports make the path from source to finding visible and keep uncertainty close to the claim.
Prefer public records and primary releases, then identify the exact period and population used.
Explain calculations, scenario assumptions, exclusions and why comparisons are appropriate.
Separate observed facts from estimates, examples, planning ranges and individual advice.
Put the evidence to work
Research provides context. Use the related tools, definitions and accountability pages to understand how that context applies—and where it does not.
Model a scenario
Change your own inputs and compare outcomes with documented formulas and limitations.
ExploreClarify a term
Understand the tax, debt, housing, banking and retirement terms used in the reports.
ExploreCheck accountability
See how to report a possible error and how material corrections are handled.
ExploreResearch questions
How sources, downloads, citations and corrections work across the research library.
Each report names its own sources and links to the underlying material where available. Sources commonly include public agencies, regulator releases, official surveys, research institutions and other primary records relevant to that report.
When a report includes a downloadable dataset or chart-data file, the link appears on the report page and is available without creating an account. Each download is paired with methodology and limitation notes.
Yes. Link to the report, identify FinanceFirst as the publisher and preserve the report date and scope. For a numerical claim, cite the original source named in the report whenever possible.
Reports display publication and update context, distinguish observed data from scenarios or estimates, and link to the FinanceFirst corrections policy for reporting a possible error.